Optimizing SQL Queries or Tracking Dangerous Criminals
Learn SQL optimization techniques through a real case study from Appbooster.com. Discover how to balance development speed, code readability, and performance.

I believe that virtually every project using Ruby on Rails and Postgres as its main backend tools is in a constant struggle between development speed, code readability/maintainability, and project performance in production. I will share my experience balancing these three pillars in a case where readability and performance suffered initially, but in the end, I managed to achieve what several talented engineers had unsuccessfully attempted before me.
The whole story will take several parts. This is the first one, where I’ll talk about what PMDSC is for optimizing SQL queries, share useful tools for measuring query performance in Postgres, and remind you of one useful old cheat sheet that is still relevant.
Now, after some time has passed, in hindsight, I realize that I didn’t expect everything to work out in this case. Therefore, this post will be more useful for bold and less experienced developers than for super-seniors who have seen Rails with raw SQL.
BackgroundLink to section: Background
At Appbooster, we focus on promoting mobile applications. To easily propose and test hypotheses, we develop several of our applications. The backend for most of them is a Rails API and Postgresql.
The hero of this publication has been developed since the end of 2013—just after rails 4.1.0.beta1 was released. Since then, the project has grown into a fully loaded web application that runs on several servers in Amazon EC2 with a separate database instance in Amazon RDS (db.t3.xlarge with 4 vCPU and 16 GB RAM). Peak loads reach 25k RPM, with an average load of 8-10k RPM during the day.
This story began with the database instance, or more precisely, with its credit balance.
View image: RDS Credit balance low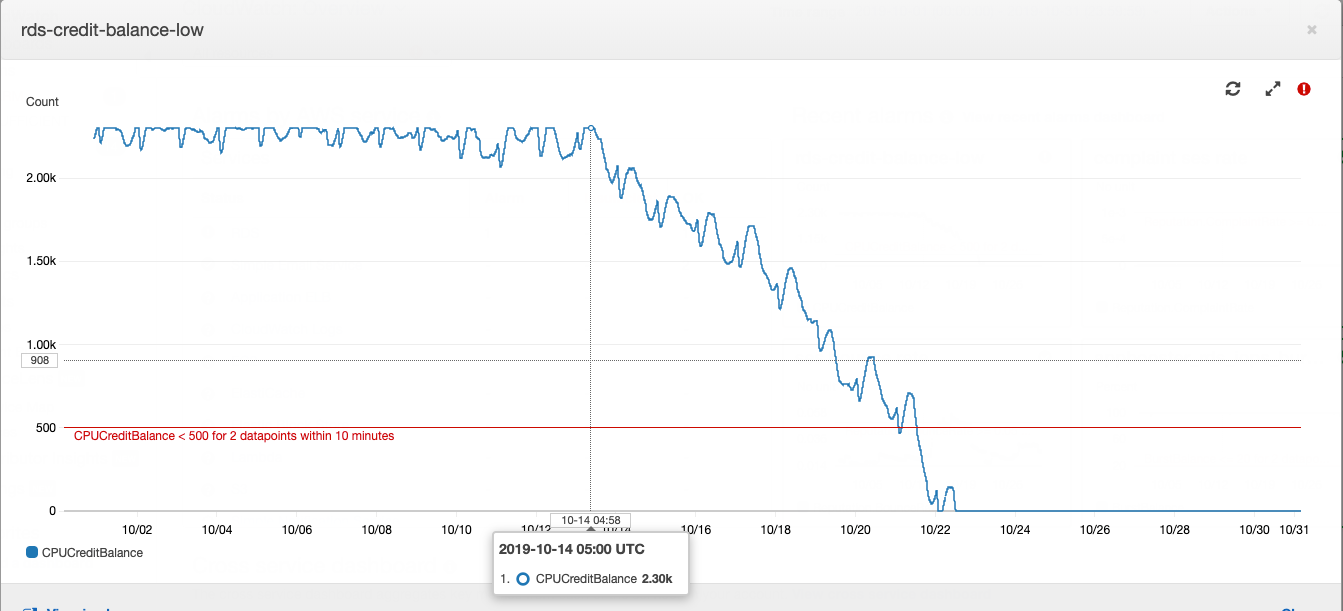
How a “t” type Postgres instance works in Amazon RDS: if your database operates with an average CPU utilization below a certain threshold, credits accumulate in your account, which the instance can spend on CPU consumption during high-load hours—this allows you to avoid overpaying for server power and cope with high loads. More details on what and how much you pay using AWS can be found in our CTO’s article (RU).
At some point, the credit balance was depleted. For some time, this was not given much importance, as the credit balance could be replenished with money—this cost us about $20 per month, which is not very significant compared to the overall expenses for renting computational resources. In product development, the focus is usually on tasks formulated from business requirements. Increased consumption of CPU resources by the database server falls under technical debt and is covered by small expenses for purchasing credit balance.
One fine day, I wrote in the daily summary that I was very tired of extinguishing the periodic “fires” that occurred in different parts of the project. If this continues, the burned-out developer will spend time on business tasks. On the same day, I approached the project manager, explained the situation, and asked for time to investigate the causes of the periodic fires and make repairs. After receiving approval, I began to collect data from various monitoring systems.
We use New Relic to track the overall response time over the course of a day. The picture looked like this:
View image: Newrelic dashboard screenshoot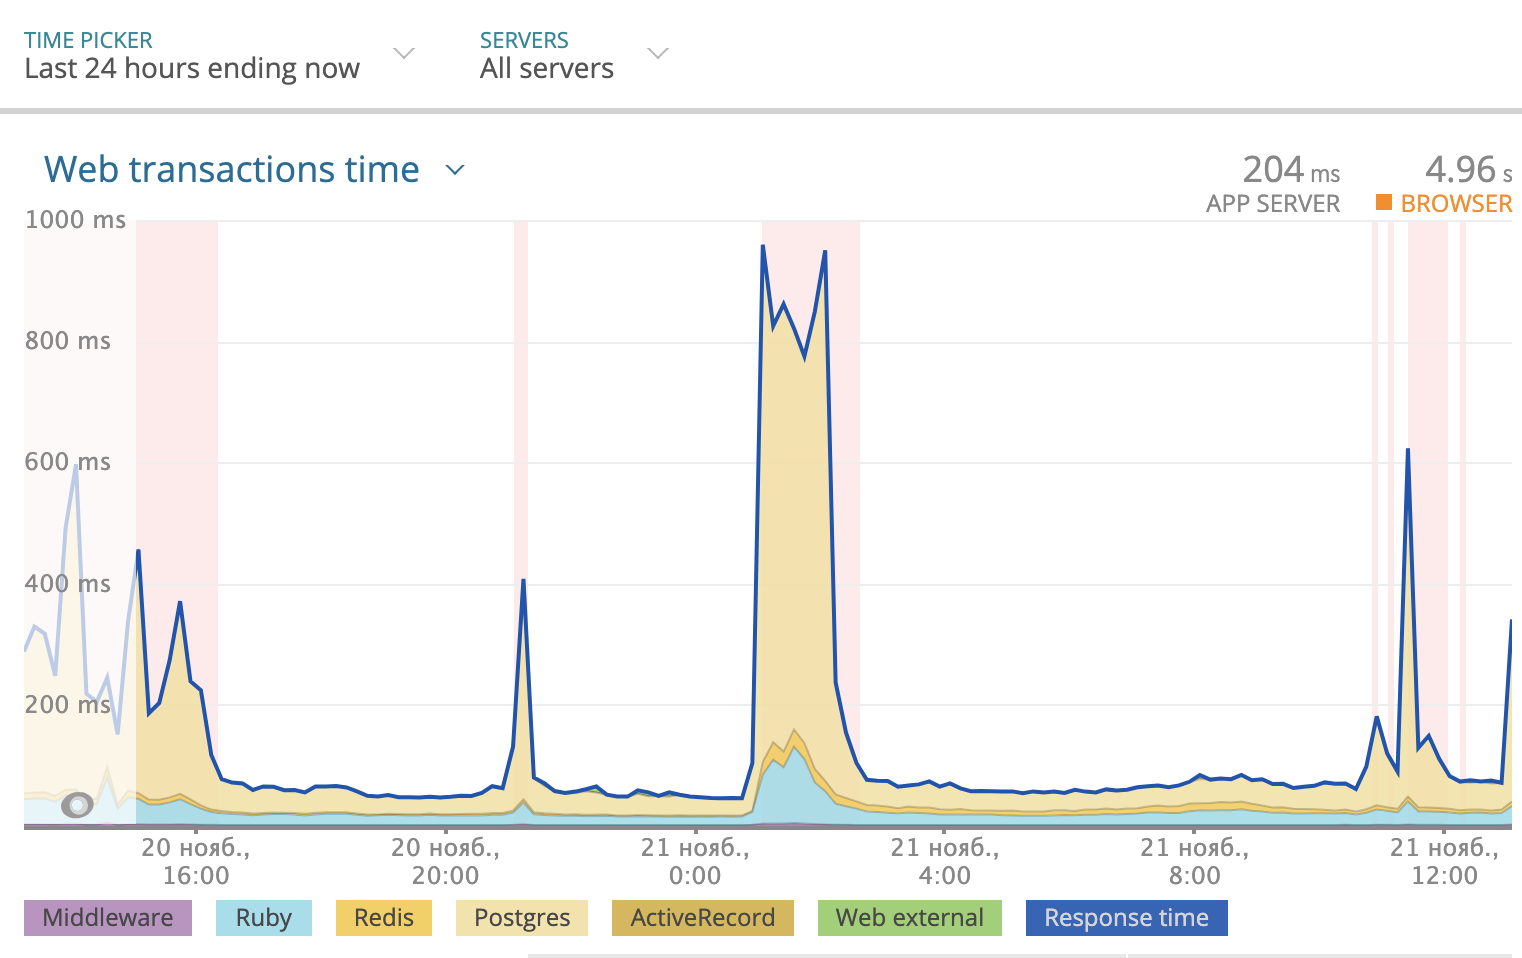
The yellow highlighted part on the graph represents the response time taken by Postgres. As can be seen, sometimes the response time reached 1000 ms, and most of the time, it was the database that was pondering the response. This means we need to look at what’s happening with the SQL queries.
PMDSC is a simple and understandable practice for any tedious task of optimizing SQL queries.Link to section: PMDSC is a simple and understandable practice for any tedious task of optimizing SQL queries.
- Play it!
- Measure it!
- Draw it!
- Suppose it!
- Check it!
Play it!Link to section: Play it!
Perhaps the most important part of the whole practice. When someone mentions “Optimizing SQL queries,” it tends to provoke yawning and boredom in the vast majority of people. When you say “Detective investigation and tracking down dangerous villains,” it engages and sets you in the right mood. So, it’s important to get into the game. I enjoyed playing detective. I imagined that database problems were either dangerous criminals or rare diseases. And I imagined myself as Sherlock Holmes, Lieutenant Columbo, or Dr. House. Choose the hero to your liking and go ahead!
Measure It!Link to section: Measure It!
View image: Measure it! PGhero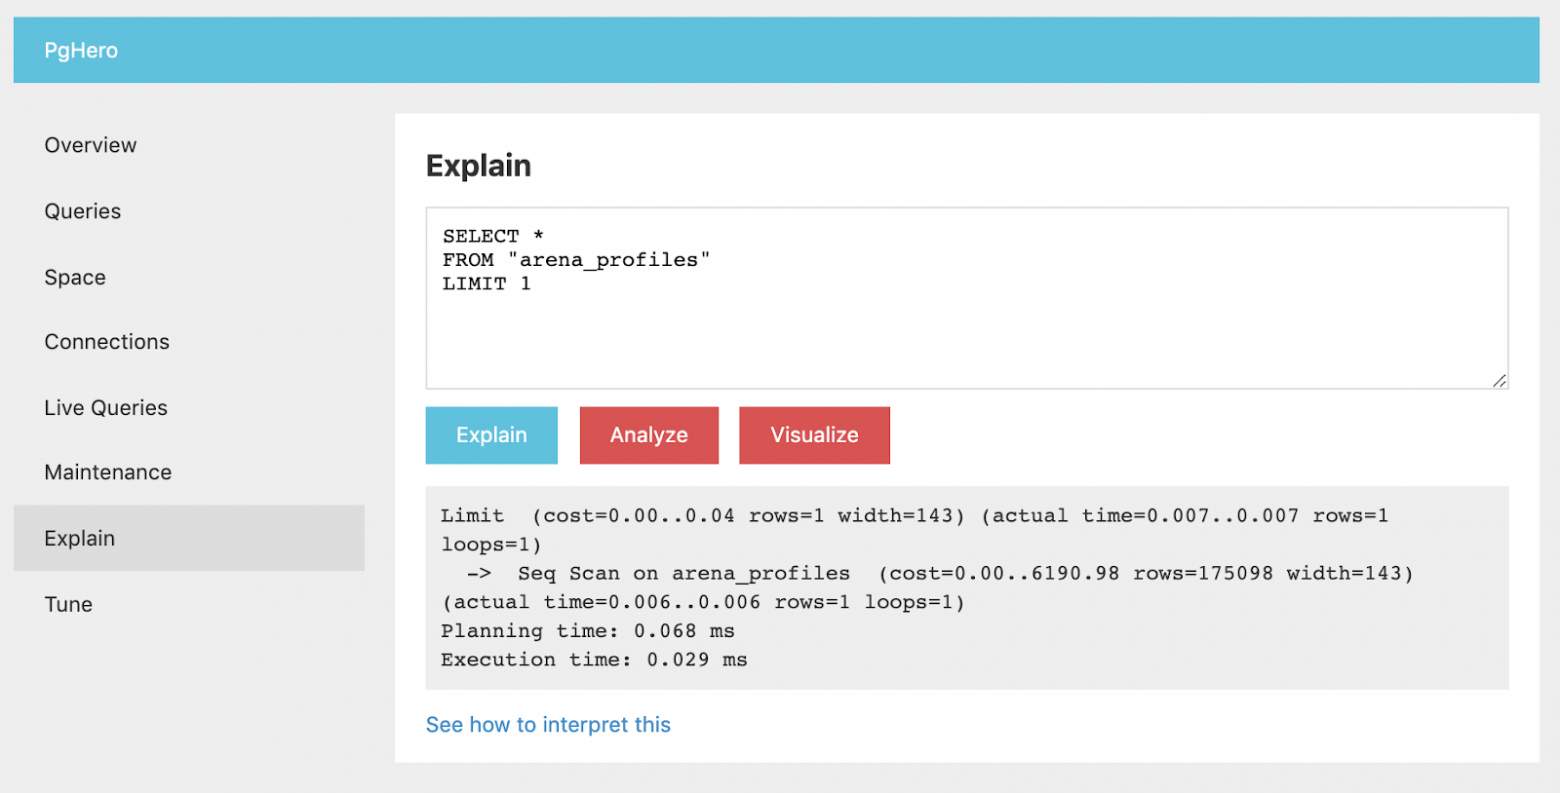
For analyzing query statistics, I installed PgHero. This is a very convenient way to read data from the pg_stat_statements extension for Postgres. We go to /queries and look at the statistics of all queries for the last day. The default sorting of queries is by the Total Time column - the proportion of total time the database processes the query - a valuable source in the search for suspects. Average Time - how long, on average, a query takes to execute. Calls - how many queries were there in the selected time frame. PgHero considers slow queries those that were executed more than 100 times per day and took on average more than 20 milliseconds. The list of slow queries is on the first page, right after the list of duplicate indexes.
We take the first one in the list and look at the details of the query, where you can immediately see its explain analyze. If the planning time is significantly less than the execution time, it means there is something wrong with this query, and we focus our attention on this suspect.
PgHero has its way of visualization, but I preferred using explain.depesz.com by copying the data from explain analyze there.
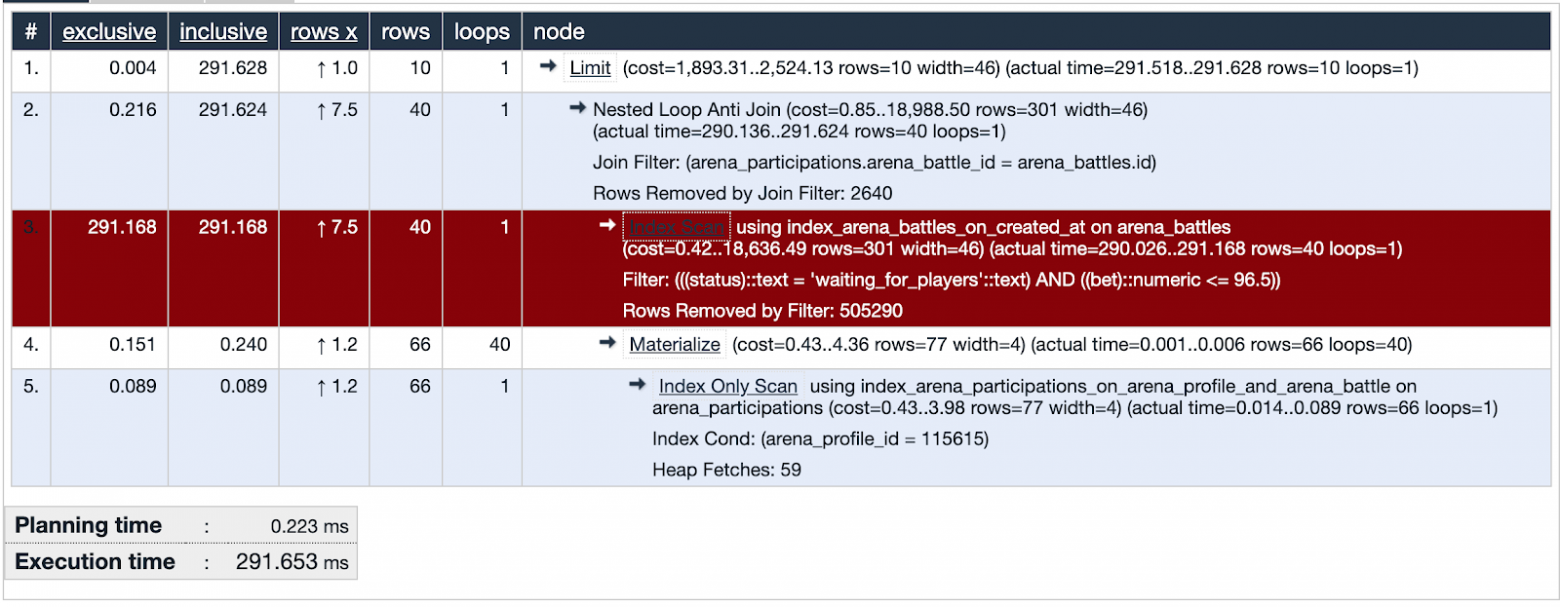
One of the suspect queries uses an Index Scan. The visualization shows that this index is not efficient and is a weak point—highlighted in red. Great! We have examined the suspect’s tracks and found an important clue! Justice is inevitable!
Draw it!Link to section: Draw it!
Let’s draw a set of data used in the problematic part of the query. It will be useful to compare it with the data covered by the index.
A bit of context. We were testing one of the ways to retain users in the application—something like a lottery where you can win some internal currency. You place a bet, guess a number from 0 to 100, and take the whole bank if your number is closest to what the random number generator got. We called it the “Arena,” and the draws were called “Battles.”
View image: Battles SQL visualisation
In the database at the time of the investigation, there were about five hundred thousand records of battles. In the problematic part of the query, we are looking for battles where the bet does not exceed the user’s balance and the status of the battle is “waiting for players.” We see that the intersection of sets (highlighted in orange) is a very small number of records.
The index used in the suspected part of the query covers all created battles by the created_at field. The query goes through 505,330 records, selects 40 of them, and filters out 505,290. It looks very wasteful.
Suppose it!Link to section: Suppose it!
We make a hypothesis. What will help the database find forty records out of five hundred thousand? Let’s try to create an index that covers the bet field, but only for battles with the status “waiting for players” — a partial index.
1
2
3
  add_index :arena_battles, :bet,
            where: "status = 'waiting_for_players'",
            name: "index_arena_battles_on_bet_partial_status"
Partial index - exists only for those records that meet the condition: the status field is equal to “waiting_for_players” and indexes the bet field - exactly what is in the query condition. It is very beneficial to use this index: it takes up only 40 kilobytes and does not cover battles that have already been played and are not needed for our selection. For comparison - the index index_arena_battles_on_created_at, which was used by the suspect, takes up about 40 MB, and the battles table is about 70 MB. This index can be safely deleted if it is not used by other queries.
Check it!Link to section: Check it!
We deploy a migration with a new index to production and observe how the response of the endpoint with battles changes.
View image: Battles SQL visualisation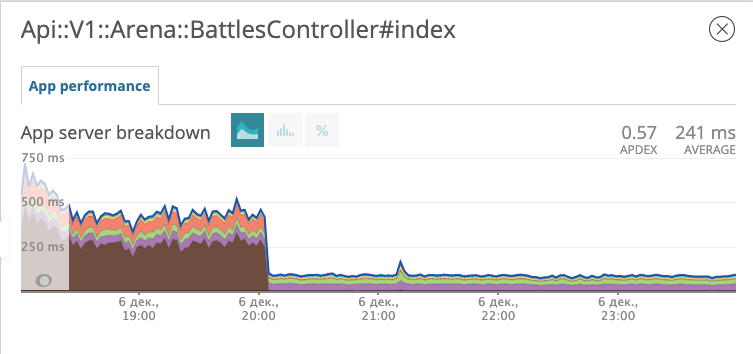
The graph shows when we deployed the migration. In the evening of December 6, the response time decreased by about 10 times, from ~500 ms to ~50 ms. The suspect in the trial received the status of a prisoner and is now in jail. Excellent!
Prison BreakLink to section: Prison Break
A few days later, we realized that we were celebrating too early. It seems the prisoner found accomplices, developed and executed an escape plan.
View image: Battles SQL visualisation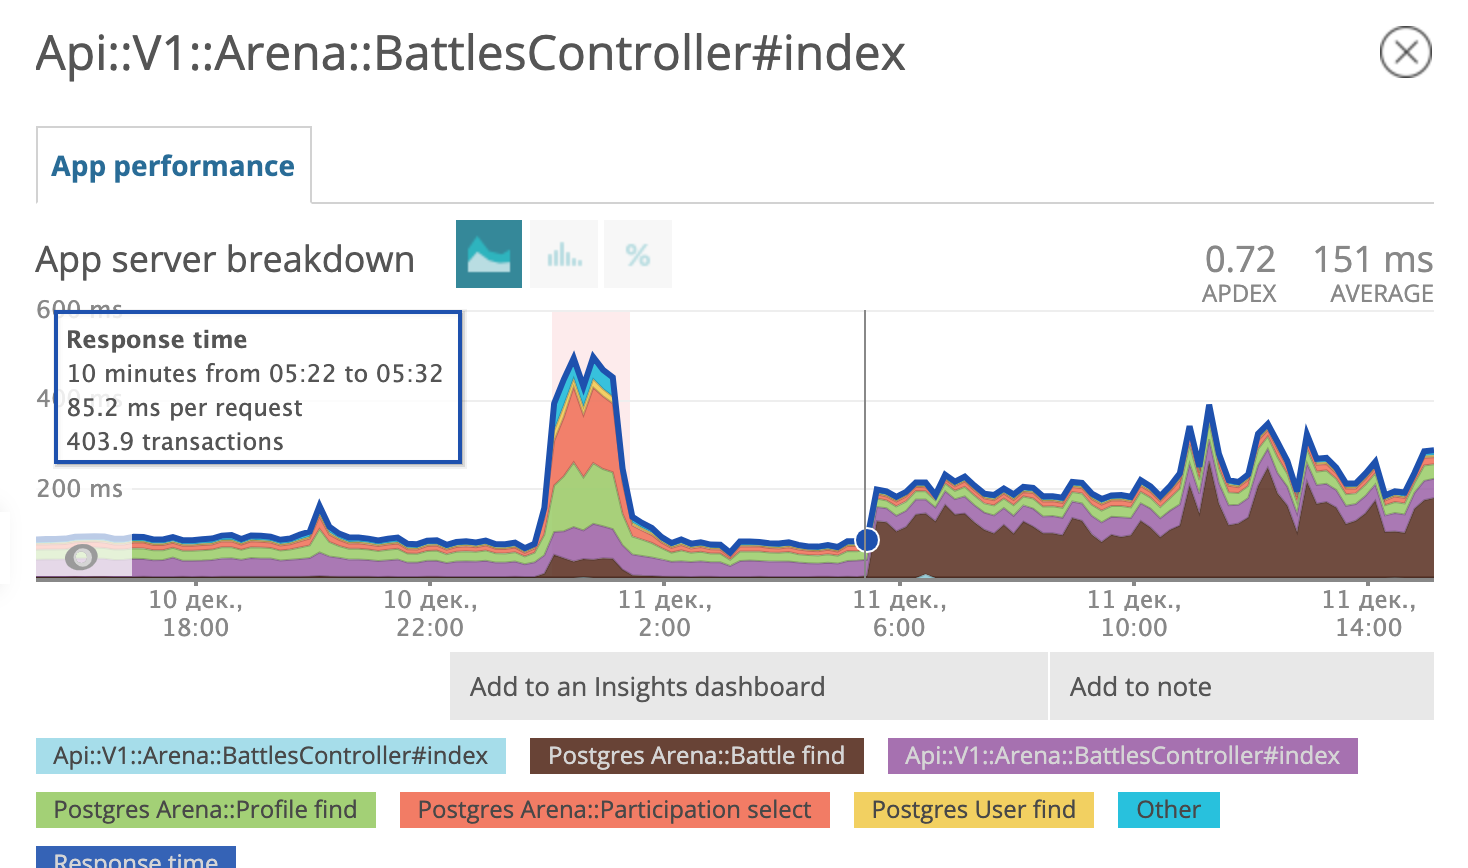
In the morning of December 11, the Postgres query planner decided that using the fresh partial index was no longer beneficial and started using the old one again.
We are back to the “Suppose it!” stage. We are gathering a differential diagnosis, in the spirit of Dr. House:
- Maybe we need to optimize Postgres settings;
- Perhaps, perform a minor update of Postgres to a new version (9.6.11 -> 9.6.15);
- Or maybe, carefully study which SQL query Rails is forming?
We checked all three hypotheses. The last one led us to the next accomplice.
1
2
3
4
5
6
7
8
9
10
11
SELECT "arena_battles".*
FROM "arena_battles"
WHERE "arena_battles"."status" = 'waiting_for_players'
   AND (arena_battles.bet <= 98.13)
   AND (NOT EXISTS (
            SELECT 1 FROM arena_participations
            WHERE arena_battle_id = arena_battles.id
              AND (arena_profile_id = 46809)
          ))
ORDER BY "arena_battles"."created_at" ASC
LIMIT 10 OFFSET 0
Let’s walk through this SQL together. We select all fields of battles from the battles table where the status is “waiting for players” and the bet is less than or equal to a certain number. So far, so good. The next part of the condition looks awful.
1
2
3
4
5
NOT EXISTS (
            SELECT 1 FROM arena_participations
            WHERE arena_battle_id = arena_battles.id
              AND (arena_profile_id = 46809)
          )
We are looking for a non-existent result of a subquery. Fetch the first field from the battle participation table, where the battle identifier matches and the participant’s profile belongs to our player. I’ll try to draw the set described in the subquery.
View image: Subquery visualisation
It’s hard to make sense of, but in the end, this subquery was an attempt to exclude battles in which the player is already participating. We look at the overall explain of the query and see Planning time: 0.180 ms, Execution time: 12.119 ms. We found an accomplice!
Now it’s time for my favorite cheat sheet, which has been circulating on the internet since 2008. Here it is:
View image: SQL Optimisation cheet sheet
Yes! Whenever a query includes something that should exclude a certain number of records based on data from another table, this meme with a beard and curls should come to mind.
Actually, here’s what we need:
View image: Actual SQL Optimisation cheet sheet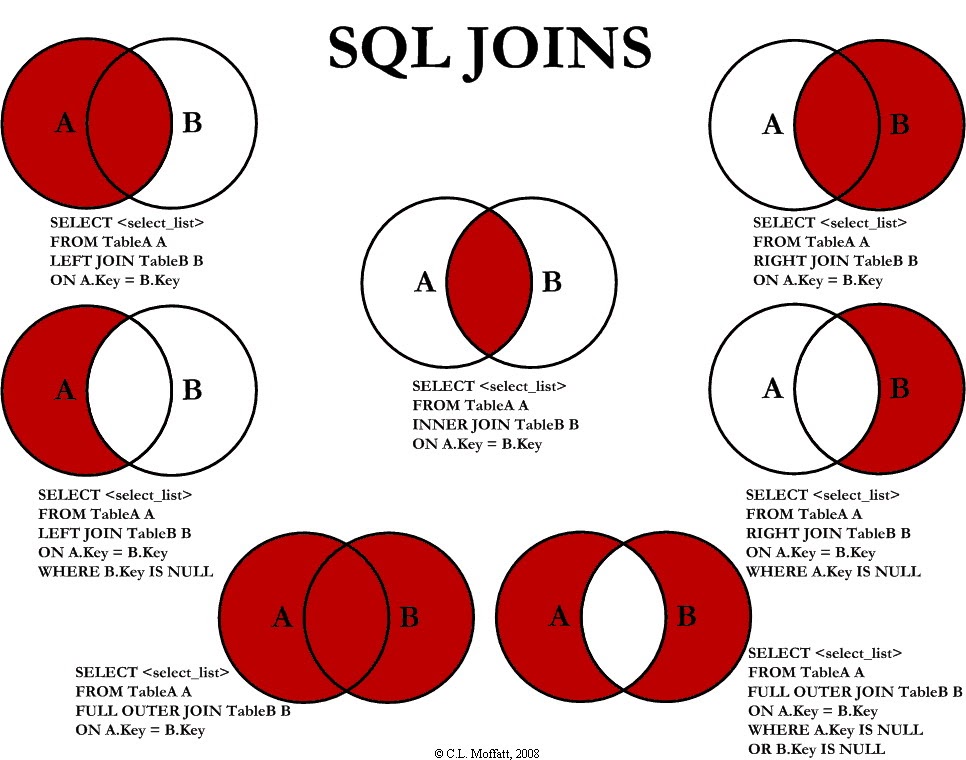
Save this picture for yourself, and even better, print it out and hang it in several places in the office.
We rewrite the subquery to LEFT JOIN WHERE B.key IS NULL, and we get:
1
2
3
4
5
6
7
8
9
10
SELECT "arena_battles".*
FROM "arena_battles"
LEFT JOIN arena_participations
   ON arena_participations.arena_battle_id = arena_battles.id
   AND (arena_participations.arena_profile_id = 46809)
WHERE "arena_battles"."status" = 'waiting_for_players'
   AND (arena_battles.bet <= 98.13)
   AND (arena_participations.id IS NULL)
ORDER BY "arena_battles"."created_at" ASC
LIMIT 10 OFFSET 0
The corrected query runs immediately on both tables. We joined the table with records of user participation in battles “on the left” and added a condition that the participation identifier does not exist. We look at the explain analyze of the resulting query: Planning time: 0.185 ms, Execution time: 0.337 ms. Excellent! Now the query planner will not hesitate to use the partial index, but will use the fastest option. The escaped prisoner and his accomplice are sentenced to life imprisonment in a maximum-security facility. It will be harder for them to escape.
In conclusion:Link to section: In conclusion:
- Use New Relic or a similar service to find clues. We realized that the problem lies specifically in the database queries.
- Use the PMDSC practice - it works and is engaging in any case.
- Use PgHero to find suspects and examine clues in SQL query statistics.
- Use explain.depesz.com - it’s convenient to read explain analyze of queries there.
- Try drawing data sets when you don’t understand what a query is doing.
- Remember the tough guy with curls in different places on his head when you see a subquery that looks for something that doesn’t exist in another table.
- Play detective, you might even get a badge.
The original article was published in the Russian-speaking community Habr in 2020. The translation into English was done with the help of GPT-3. The original article can be found here.
Comments powered by Disqus.